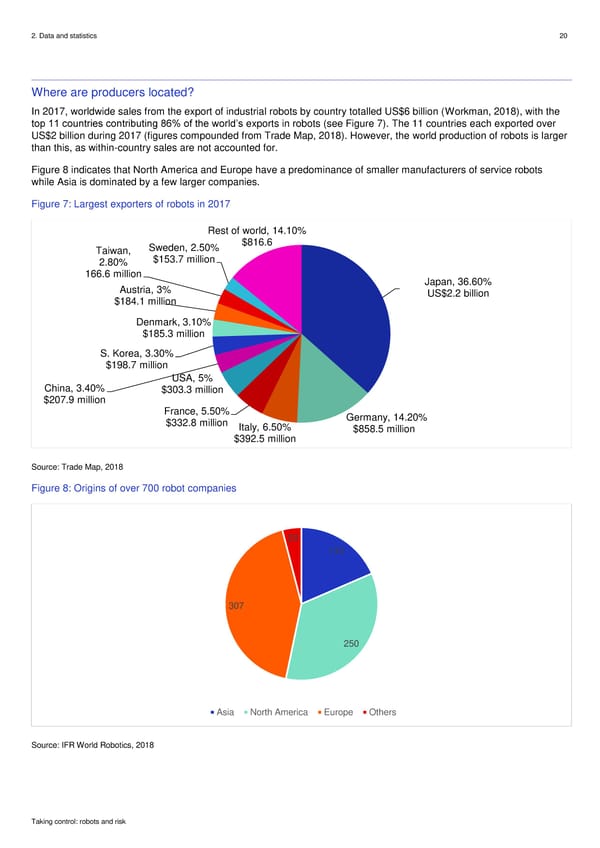
2. Data and statistics 20 Where are producers located? In 2017, worldwide sales from the export of industrial robots by country totalled US$6 billion (Workman, 2018), with the top 11 countries contributing 86% of the world’s exports in robots (see Figure 7). The 11 countries each exported over US$2 billion during 2017 (figures compounded from Trade Map, 2018). However, the world production of robots is larger than this, as within-country sales are not accounted for. Figure 8 indicates that North America and Europe have a predominance of smaller manufacturers of service robots while Asia is dominated by a few larger companies. Figure 7: Largest exporters of robots in 2017 Rest of world, 14.10% Taiwan, Sweden, 2.50% $816.6 2.80% $153.7 million 166.6 million Japan, 36.60% Austria, 3% US$2.2 billion $184.1 million Denmark, 3.10% $185.3 million S. Korea, 3.30% $198.7 million China, 3.40% USA, 5% $207.9 million $303.3 million France, 5.50% Germany, 14.20% $332.8 million Italy, 6.50% $858.5 million $392.5 million Source: Trade Map, 2018 Figure 8: Origins of over 700 robot companies 29 133 307 250 Asia North America Europe Others Source: IFR World Robotics, 2018 Taking control: robots and risk
 Robots & Risk Page 19 Page 21